Mobile geolocation data provide new opportunities to understand processes of neighborhood change and the dynamics of community connectedness, but introduce significant social, ethical, and computational challenges. Our work in this area leverages large-scale data to identify, model, and analyze mobility behavior and emergent community networks, while developing privacy-preserving approaches to geolocational analytics. We study disparities in evacuation and recovery patterns during and after natural disasters, public-space and park utilization and its influence on community well-being, neighborhood change prediction and new measures of integration, and real-time population dynamics to supplement existing survey-based census methods.
Currently, our research is focused on the COVID-19 pandemic. We are developing computational models derived from these data to (1) estimate exposure density across a range of temporal and spatial scales, which will enable public health officials and researchers to evaluate and predict transmission rates in at-risk communities; (2) measure and evaluate the extent and effectiveness of social (physical) distancing over time and within and across neighborhoods and cities, as well as understand the disparate impacts on vulnerable communities and populations; and (3) measure the extent of disease spread based on aggregated travel patterns between neighborhoods and communities.
Recent projects
Measuring inequality in community resilience to natural disasters using large-scale mobility data
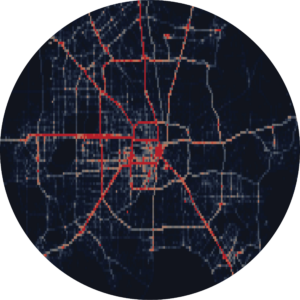
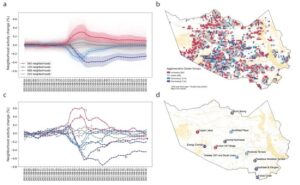
While conceptual definitions provide a foundation for the study of disasters and their impacts, the challenge for researchers and practitioners alike has been to develop objective and rigorous measures of resilience that are generalizable and scalable, taking into account spatiotemporal dynamics in the response and recovery of localized communities. In this paper, we analyze mobility patterns of more than 800,000 anonymized mobile devices in Houston, Texas, representing approximately 35% of the local population, in response to Hurricane Harvey in 2017. Using changes in mobility behavior before, during, and after the disaster, we empirically define community resilience capacity as a function of the magnitude of impact and time-to-recovery. Overall, we find clear socioeconomic and racial disparities in resilience capacity and evacuation patterns. Our work provides new insight into the behavioral response to disasters and provides the basis for data-driven public sector decisions that prioritize the equitable allocation of resources to vulnerable neighborhoods.
Exposure Density and Neighborhood Disparities in COVID-19 Infection Risk
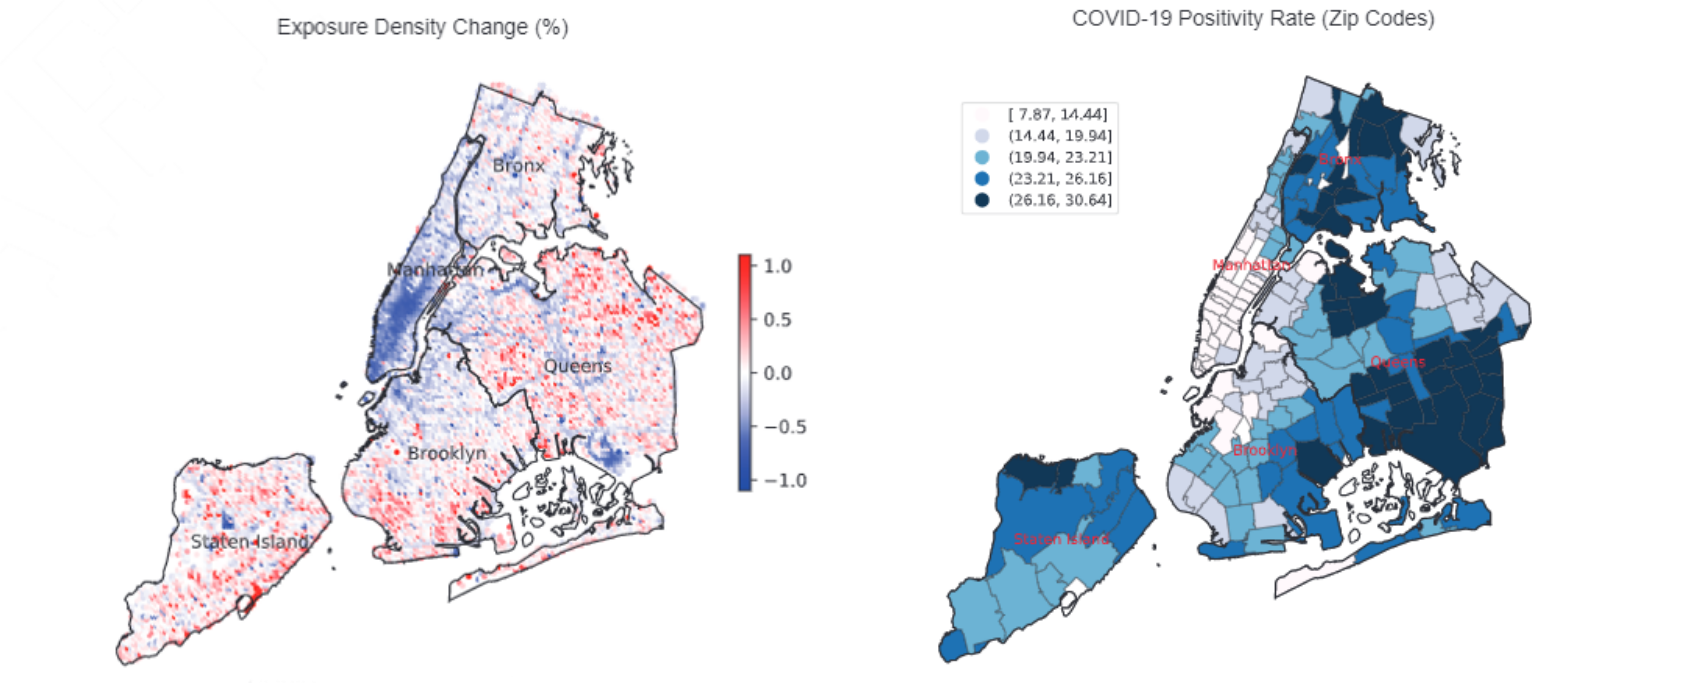
Although there is increasing awareness of disparities in COVID-19 infection risk among vulnerable communities, the effect of behavioral interventions at the scale of individual neighborhoods has not been fully studied. We develop a method to quantify neighborhood activity behaviors at high spatial and temporal resolutions and test whether, and to what extent, behavioral responses to social-distancing policies vary with socioeconomic and demographic characteristics. We define exposure density (ExρExρ) as a measure of both the localized volume of activity in a defined area and the proportion of activity occurring in distinct land-use types. Using detailed neighborhood data for New York City, we quantify neighborhood exposure density using anonymized smartphone geolocation data over a 3-mo period covering more than 12 million unique devices and rasterize granular land-use information to contextualize observed activity. Next, we analyze disparities in community social distancing by estimating variations in neighborhood activity by land-use type before and after a mandated stay-at-home order. Finally, we evaluate the effects of localized demographic, socioeconomic, and built-environment density characteristics on infection rates and deaths in order to identify disparities in health outcomes related to exposure risk. Our findings demonstrate distinct behavioral patterns across neighborhoods after the stay-at-home order and that these variations in exposure density had a direct and measurable impact on the risk of infection. Notably, we find that an additional 10% reduction in exposure density city-wide could have saved between 1,849 and 4,068 lives during the study period, predominantly in lower-income and minority communities.
Digital footprints: Using WiFi probe and locational data to analyze human mobility trajectories in cities
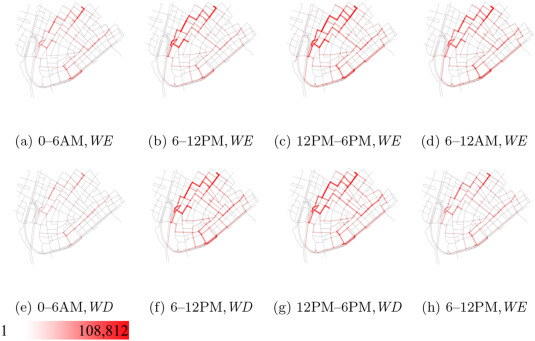
City governments all over the world face challenges understanding mobility patterns within dense urban environments at high spatial and temporal resolution. While such measures are important to provide insights into the functional patterns of a city, novel quantitative methods, derived from ubiquitous mobile connectivity, are needed to provide policy-makers with better insights to improve urban management and planning decisions. In this paper, we develop a model that uses large-scale WiFi probe request data to model urban mobility trajectories in dense urban environments. We collect probe request data from a public Wifi network with 54 access points in the Lower Manhattan section of New York City over one week, accounting for more than 30 million observations and over 800,000 unique devices. First, we aggregate unique entries per access point and per hour, demonstrating the potential to use WiFi data to approximate local population counts by type of user. We then use a spatial network analysis to identify edge frequencies and directions of journeys between the network nodes, and apply the results to the road and pedestrian sidewalk network to identify usage intensity levels and trajectories for individual street segments. We demonstrate the significant potential in the use of WiFi probe request data for understanding mobility patterns in cities, while highlighting non-trivial issues in data privacy raised by the growing availability of public WiFi networks.


