Bias and fairness in data-driven decision-making
Uncovering data and algorithmic bias in urban predictive analytics and developing fair and transparent methods for public resource allocation.
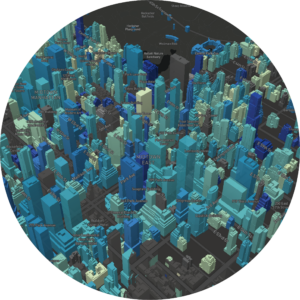
Data for climate action
Advancing energy and carbon modeling to enable data-driven climate policy and energy efficiency investment decisions for more sustainable, resilient, and just cities.
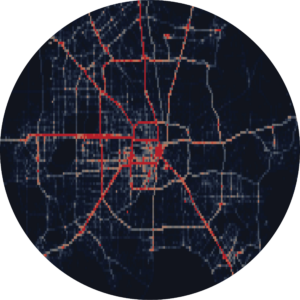
Neighborhood dynamics and inequality
Using large-scale mobility and social media data to understand neighborhood change and community connectedness, and to develop privacy-preserving approaches to geolocational analytics.
AI for city management
Building computational methods to support efficient, equitable, and sustainable city operations.
Recent Projects
Building retrofit hurdle rates and risk aversion in energy efficiency investments
Despite extensive empirical evidence of the environmental benefits of green buildings and the increasing urgency to reduce carbon emissions in cities, there has been limited widespread adoption of energy retrofit investments in existing buildings. In this paper, we empirically model financial returns to energy retrofit investments for more than 3600 multifamily and commercial buildings in New York City, using a comprehensive database of energy audits and renovation work extracted from city records using a natural language processing algorithm. Based on auditor cost and savings estimates, the median internal rate of return for adopted energy conservation measures is 21% for multifamily buildings and 25% for office properties. Logistic regression modeling demonstrates adoption rates are higher for office buildings than multifamily, and in both cases adopter buildings tend to be larger, higher value, and less energy efficient prior to retrofit implementation. The economically significant magnitudes of returns to adopted energy conservation measures raise important questions about why many property owners choose not to adopt. As such, we discuss incentive and regulatory mechanisms that can overcome financial and informational barriers to the adoption of energy efficiency measures.
Exposure Density and Neighborhood Disparities in COVID-19 Infection Risk
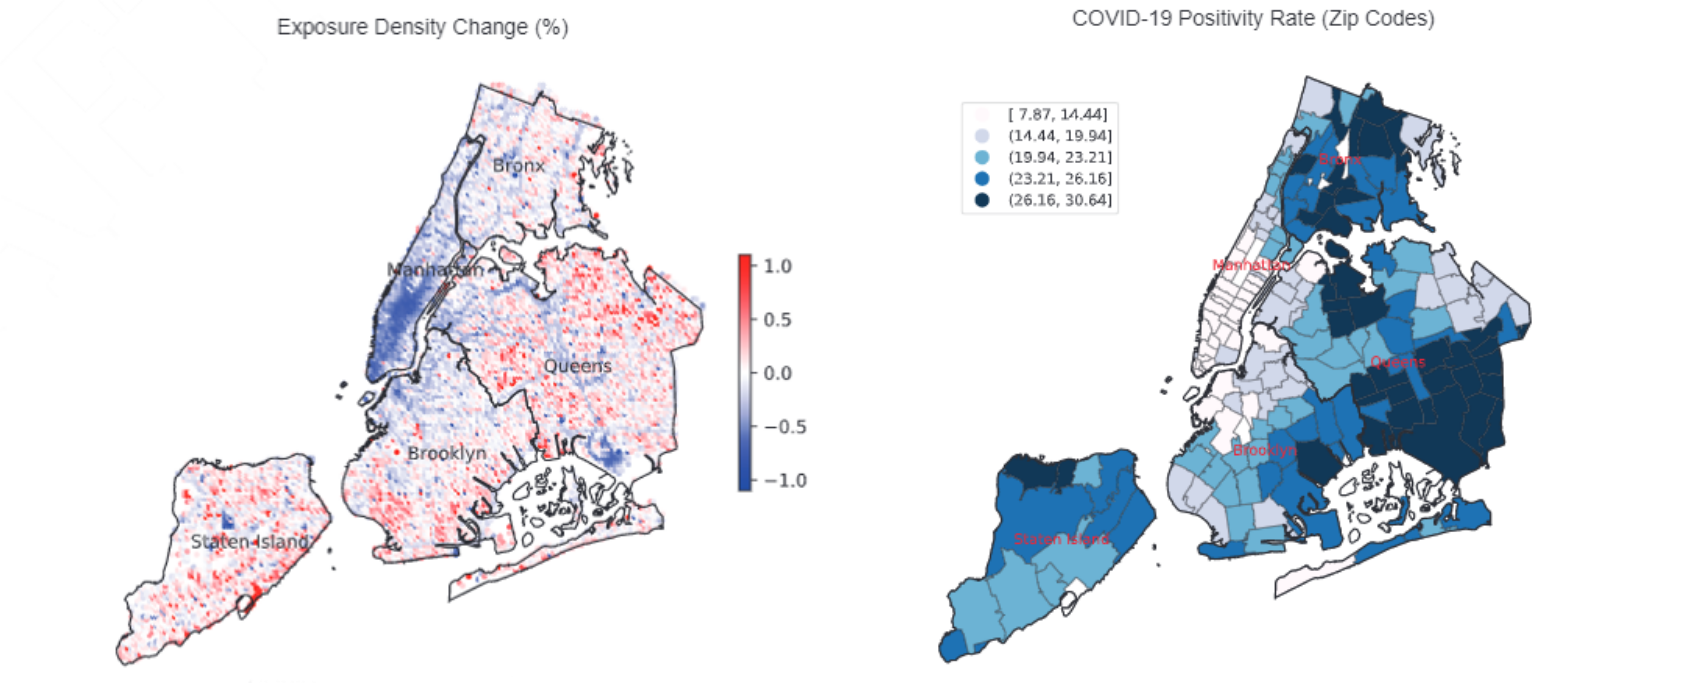
Although there is increasing awareness of disparities in COVID-19 infection risk among vulnerable communities, the effect of behavioral interventions at the scale of individual neighborhoods has not been fully studied. We develop a method to quantify neighborhood activity behaviors at high spatial and temporal resolutions and test whether, and to what extent, behavioral responses to social-distancing policies vary with socioeconomic and demographic characteristics. We define exposure density (ExρExρ) as a measure of both the localized volume of activity in a defined area and the proportion of activity occurring in distinct land-use types. Using detailed neighborhood data for New York City, we quantify neighborhood exposure density using anonymized smartphone geolocation data over a 3-mo period covering more than 12 million unique devices and rasterize granular land-use information to contextualize observed activity. Next, we analyze disparities in community social distancing by estimating variations in neighborhood activity by land-use type before and after a mandated stay-at-home order. Finally, we evaluate the effects of localized demographic, socioeconomic, and built-environment density characteristics on infection rates and deaths in order to identify disparities in health outcomes related to exposure risk. Our findings demonstrate distinct behavioral patterns across neighborhoods after the stay-at-home order and that these variations in exposure density had a direct and measurable impact on the risk of infection. Notably, we find that an additional 10% reduction in exposure density city-wide could have saved between 1,849 and 4,068 lives during the study period, predominantly in lower-income and minority communities.
Measuring inequality in community resilience to natural disasters using large-scale mobility data
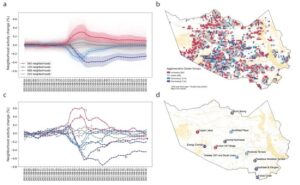
While conceptual definitions provide a foundation for the study of disasters and their impacts, the challenge for researchers and practitioners alike has been to develop objective and rigorous measures of resilience that are generalizable and scalable, taking into account spatiotemporal dynamics in the response and recovery of localized communities. In this paper, we analyze mobility patterns of more than 800,000 anonymized mobile devices in Houston, Texas, representing approximately 35% of the local population, in response to Hurricane Harvey in 2017. Using changes in mobility behavior before, during, and after the disaster, we empirically define community resilience capacity as a function of the magnitude of impact and time-to-recovery. Overall, we find clear socioeconomic and racial disparities in resilience capacity and evacuation patterns. Our work provides new insight into the behavioral response to disasters and provides the basis for data-driven public sector decisions that prioritize the equitable allocation of resources to vulnerable neighborhoods.
Up-and-Coming or Down-and-Out? Social Media Popularity as an Indicator of Neighborhood Change
By quantifying Twitter activity and sentiment for each of 274 neighborhood areas in New York City, this study introduces the Neighborhood Popularity Index and correlates changes in the index with real estate prices, a common measure of neighborhood change. Results show that social media provide both a near-real-time indicator of shifting attitudes toward neighborhoods and an early warning measure of future changes in neighborhood composition and demand. Although social media data provide an important complement to traditional data sources, the use of social media for neighborhood studies raises concerns regarding data accessibility and equity issues in data representativeness and bias.
Bias in smart city governance: How socio-spatial disparities in 311 complaint behavior impact the fairness of data-driven decisions
Governance and decision-making in “smart” cities increasingly rely on resident-reported data and data-driven methods to improve the efficiency of city operations and planning. However, the issue of bias in these data and the fairness of outcomes in smart cities has received relatively limited attention. This is a troubling and significant omission, as social equity should be a critical aspect of smart cities and needs to be addressed and accounted for in the use of new technologies and data tools. This paper examines bias in resident-reported data by analyzing socio-spatial disparities in ‘311’ complaint behavior in Kansas City, Missouri. We utilize data from detailed 311 reports and a comprehensive resident satisfaction survey, and spatially join these data with code enforcement violations, neighborhood characteristics, and street condition assessments. We introduce a model to identify disparities in resident-government interactions and classify under- and over-reporting neighborhoods based on complaint behavior. Despite greater objective and subjective need, low-income and minority neighborhoods are less likely to report street condition or “nuisance” issues, while prioritizing more serious problems. Our findings form the basis for acknowledging and accounting for data bias in self-reported data, and contribute to the more equitable delivery of city services through bias-aware data-driven processes.
The impact of mandatory energy audits on building energy use
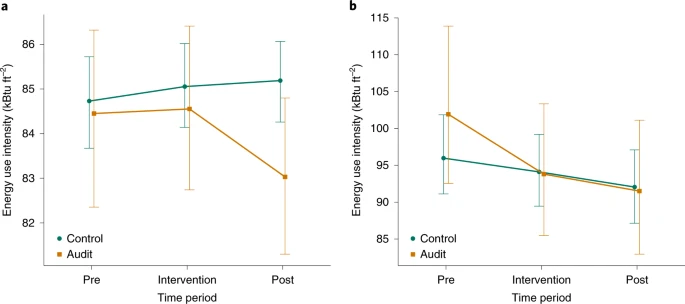
Cities are increasingly adopting energy policies that reduce information asymmetries and knowledge gaps through data transparency, including energy disclosure and mandatory audit requirements for existing buildings. Although such audits impose non-trivial costs on building owners, their energy use impacts have not been empirically evaluated. Here we examine the effect of a large-scale mandatory audit policy—New York City’s Local Law 87—on building energy use, using detailed audit and energy data between 2011 and 2016 for approximately 4,000 buildings. This specific policy context, in which the compliance year is randomly assigned, provides a unique opportunity to explore the audit effect without the self-selection bias found in studies of voluntary audit policies. We find energy use reductions of approximately –2.5% for multifamily residential buildings and –4.9% for office buildings. The results suggest that mandatory audits, by themselves, create an insufficient incentive to invest in energy efficiency at the scale needed to meet citywide carbon-reduction goals.
Take the Q Train: Value Capture of Public Infrastructure Projects
Topic modeling to discover the thematic structure and spatial-temporal patterns of building renovation and adaptive reuse in cities
Building alteration and redevelopment play a central role in the revitalization of developed cities, where the scarcity of available land limits the construction of new buildings. The adaptive reuse of existing space reflects the underlying socioeconomic dynamics of the city and can be a leading indicator of economic growth and diversification. However, the collective understanding of building alteration patterns is constrained by significant barriers to data accessibility and analysis. We present a data mining and knowledge discovery process for extracting, analyzing, and integrating building permit data for more than 2,500,000 alteration projects from seven major U.S. cities. We utilize natural
language processing and topic modeling to discover the thematic structure of construction activities from permit descriptions and merge with other urban data to explore the dynamics of urban change. The knowledge discovery process proceeds in three steps: (1) text mining to identify popular words, popularity change, and their co-appearance likelihood; (2) topic modeling using latent Dirichlet allocation (LDA); and (3) integrating the topic modeling output with building information and ancillary data to discover the spatial, temporal, and thematic patterns of urban redevelopment and regeneration. The results demonstrate a generalizable approach that can be used to analyze unstructured text data extracted from permit records across varying database structures, permit typologies, and local contexts. Our machine learning methodology can assist cities to better monitor building alteration activity, analyze spatiotemporal patterns of redevelopment, and more fully understand the economic, social, and environmental implications of changes to the urban built environment.
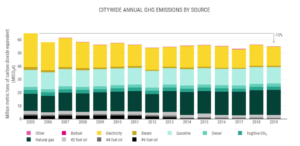
Inventory of New York City Green House Gas Emissions
Climate change has reached a crucial tipping point: our actions right now will determine the long-term health and even survival of our community and our planet. The City of New York has committed to reducing its greenhouse gas (GHG) emissions 80 percent by 2050, compared to 2005 levels. We have further committed to do our part to fulfill the Paris Agreement by accelerating our progress and developing strategies to achieve carbon neutrality by 2050. These strategies have the potential to remove 10 million tons of carbon dioxide equivalent from our air by 2020 and 500,000 pounds of fine particulate matter by 2030, preventing 40 deaths and 100 hospital visits every single year. In addition to fighting climate change, our actions will provide economic innovation, improved public health, and quality jobs for New Yorkers.


